Добрый день.
Вот он:
{
frame: {
h: 3,
w: 3,
x: 3,
y: 0,
},
display: {
gap: '0',
headerStyle: {},
},
children: [
{
id: '8:0',
frame: {
h: 0.5,
w: 1,
x: 0,
y: 0,
},
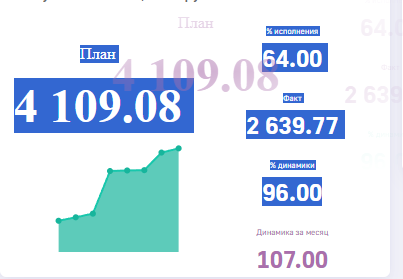
title: 'board 1',
display: {
title: 'План',
bgColor: 'transparent',
stoplight: {
lights: [
{
name: '',
color: '#ffffff',
limit: [
0,
0,
],
},
],
},
fontFamily: 'Times New Roman',
customValue: '',
headerStyle: {
color: 'rgba(112,186,77,1)',
background: 'rgba(216,58,48,1)',
},
},
options: [
'!TopBar',
'Transparent',
],
dataSource: {
koob: 'parusdbwrk.UDO_MV_ECONPLAN_BDDS_TOTAL_TBL',
style: {},
xAxis: 'SLABEL',
yAxis: 'measures',
filters: {
SLABEL: [
'=',
'План',
],
SECTION: [
'=',
'Поступления',
],
NDOC_YEAR: true,
SDOC_MONTH: true,
SDOC_QUART: true,
SDEPARTMENT_1: true,
SDEPARTMENT_2: true,
},
measures: [
'VALS:sum_VALS',
],
dimensions: [],
},
view_class: 'dashlet/111.label',
},
{
id: '8:1',
frame: {
h: 0.5,
w: 1,
x: 0,
y: 0.5,
},
title: 'board 2',
options: [
'!DisplayLegend',
'!TopBarMenu',
'!TopBar',
'!DisplayAxisYMarks',
'!DisplayAxis',
'!DisplayAxisXMarks',
'_LinesWithoutDots',
],
dataSource: {
koob: 'parusdbwrk.UDO_MV_ECONPLAN_BDDS',
style: {
measures: {
sum_FULFILLED: {
color: '#17b59c',
title: '',
},
},
},
xAxis: 'sYEARMONTH',
yAxis: 'measures',
filters: {
SECTION: [
'=',
'Поступления',
],
SSTRCODE: [
'!=',
'0001_БДДС',
],
NHIERLEVEL: [
'=',
'1',
],
},
measures: [
'sum(FULFILLED)/1000000:sum_FULFILLED',
],
dimensions: [
'sYEARMONTH',
],
},
view_class: 'dashlet/1II.stacked-area',
},
{
id: '8:2',
frame: {
h: 0.25,
w: 1,
x: 1,
y: 0,
},
title: 'board 3',
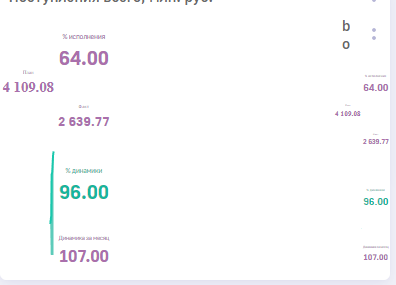
display: {
title: '% исполнения',
bgColor: 'transparent',
headerStyle: {},
},
options: [
'!TopBar',
],
dataSource: {
koob: 'parusdbwrk.UDO_MV_ECONPLAN_BDDS_TOTAL_TBL',
style: {},
yAxis: 'measures',
filters: {
SLABEL: [
'=',
'% исполнения',
],
SECTION: [
'=',
'Поступления',
],
},
measures: [
'VALS:VALS',
],
},
view_class: 'dashlet/111.label',
},
{
id: '8:3',
frame: {
h: 0.25,
w: 1,
x: 1,
y: 0.25,
},
title: 'board 4',
display: {
title: 'Факт',
bgColor: 'transparent',
headerStyle: {},
},
options: [
'!TopBar',
],
dataSource: {
koob: 'parusdbwrk.UDO_MV_ECONPLAN_BDDS_TOTAL_TBL',
style: {},
yAxis: 'measures',
filters: {
SLABEL: [
'=',
'Факт',
],
SECTION: [
'=',
'Поступления',
],
},
measures: [
'VALS:VALS',
],
},
view_class: 'dashlet/111.label',
},
{
id: '8:4',
frame: {
h: 0.25,
w: 1,
x: 1,
y: 0.5,
},
title: 'board 5',
display: {
title: '% динамики',
bgColor: 'transparent',
headerStyle: {},
},
options: [
'!TopBar',
],
dataSource: {
koob: 'parusdbwrk.UDO_MV_ECONPLAN_BDDS_TOTAL_TBL',
style: {
measures: {
S: {
color: "lpe:if(S<0, '#F05045', '#17b59c')",
title: '',
},
},
},
yAxis: 'measures',
filters: {
SLABEL: [
'=',
'% динамики',
],
SECTION: [
'=',
'Поступления',
],
},
measures: [
'sum(VALS):S',
],
},
view_class: 'dashlet/111.label',
},
{
id: '8:5',
frame: {
h: 0.25,
w: 1,
x: 1,
y: 0.75,
},
title: 'board 6',
display: {
title: 'Динамика за месяц',
bgColor: 'transparent',
headerStyle: {},
},
options: [
'!TopBar',
'ActiveTab',
],
dataSource: {
koob: 'parusdbwrk.UDO_MV_ECONPLAN_BDDS_TOTAL_TBL',
style: {},
yAxis: 'measures',
filters: {
SLABEL: [
'=',
'Динамика за месяц',
],
SECTION: [
'=',
'Поступления',
],
},
measures: [
'VALS:VALS',
],
},
view_class: 'dashlet/111.label',
},
],
dataSource: {
koob: '',
},
view_class: '11I.board',
title: 'Поступления всего, млн. руб.',
}